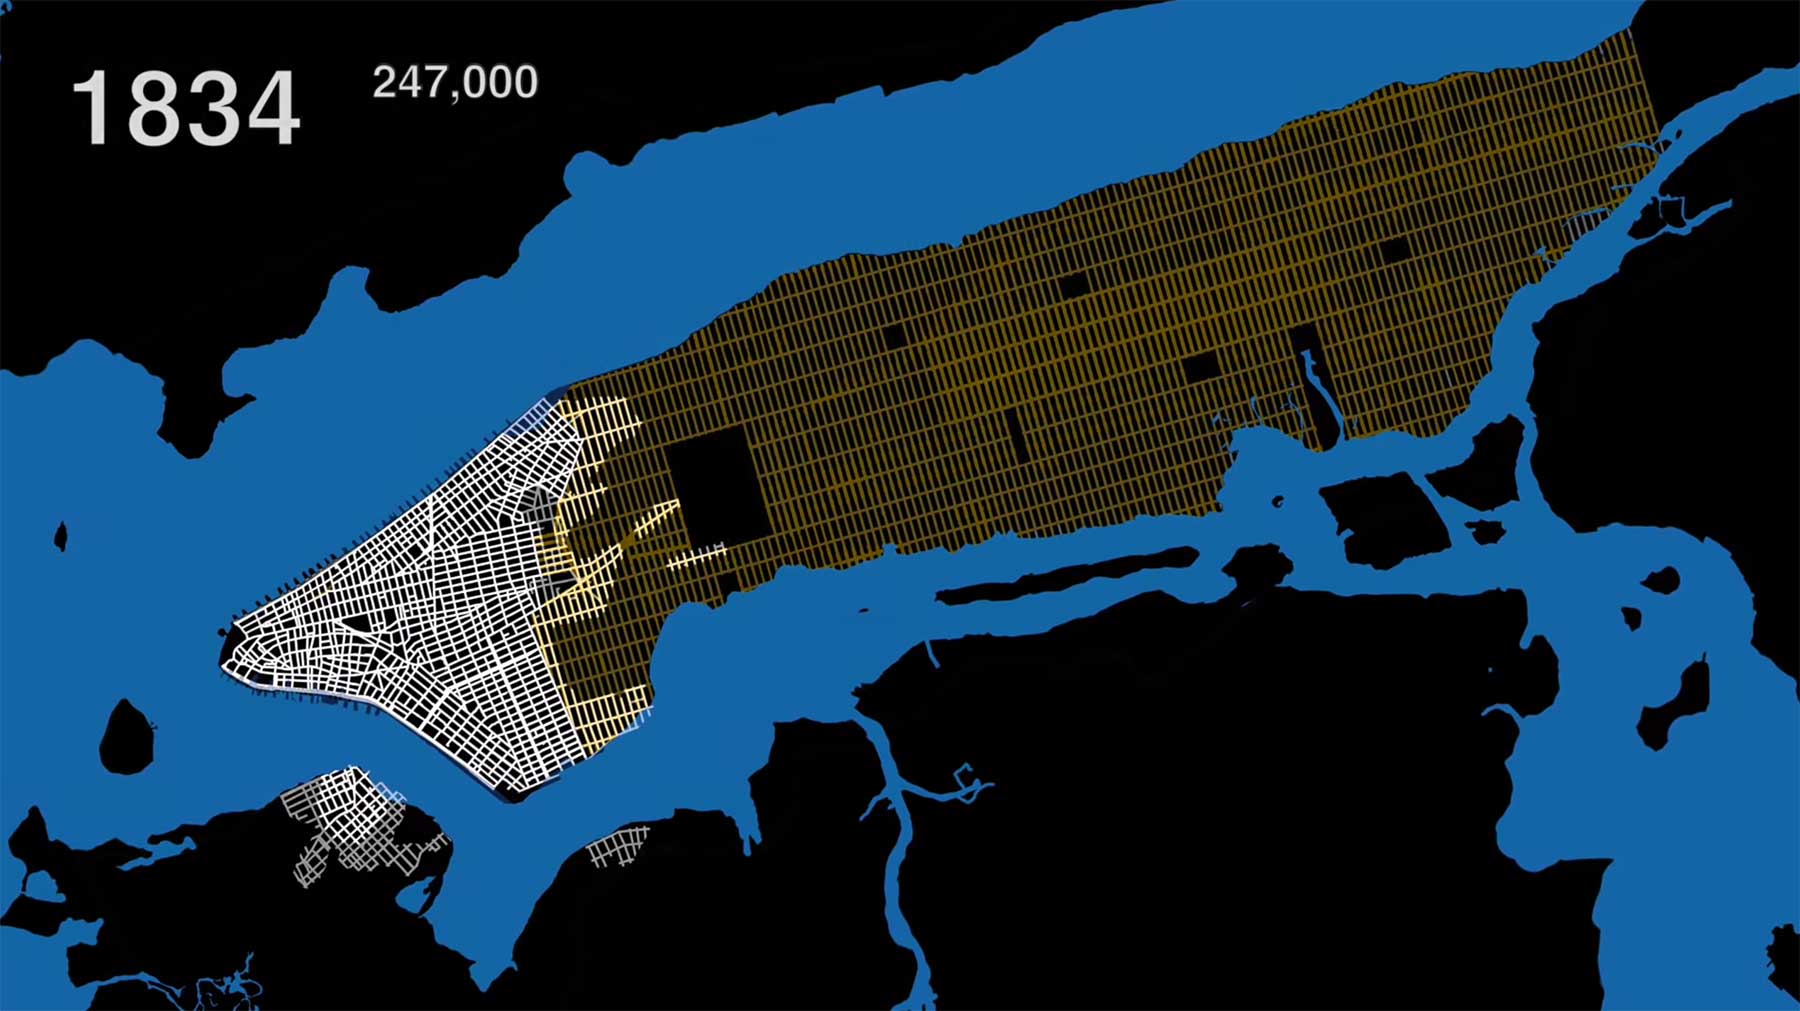
Jeder hat mal klein angefangen und auch der Big Apple war mal ein kleiner Keim, aus dem die heutige Weltmetropole erwachsen ist. Wie das über die Jahrhunderte vonstatten gegangen ist, demonstriert uns Daten-Analyst Myles Zhang in dieser interessanten Visualisierung.
„This animation illustrates the development of NYC’s street grid and infrastructure systems from 1609 to the present-day, using geo-referenced road network data and historic maps. The resulting short film presents a series of “cartographic snapshots” of NYC’s built-up urban area at intervals of every 20-30 years history.“
Alle Informationen zur Methodik und Darstellungsform des Videos „The New York City Evolution Animation“ gibt es hier nachzulesen.


Thank you for featuring my data visualization about New York City history.
A related project that might interest you is my visual history of Berlin:
https://www.myleszhang.org/2020/01/31/berlin/
You’re welcome and I’ll take a look! :)
Pingback: Berlin: Veränderung von Stadtplan und Bevölkerung (1415-2020)